Profile a source table
Once a source table is connected, profiling tells the platform what’s in it. The platform then uses that knowledge to suggest field mappings, name fields in business terms, and flag fields you should include.
Applies to: Domain expert Detail level: Standard
Who this is for
You’ve connected a source table to a model and you’re ready to look at what’s actually in it. You don’t need to know SQL or have profiled tables before; the platform does the work.
Before you start
You’ll need:
- A source table connected to a model on the canvas. See Connect a source table to a model.
Two profile options
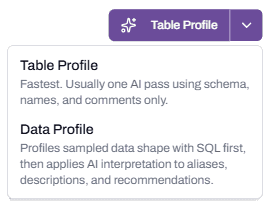
Click the source table card to open the Edit Source Table Mapping dialog. The button at the top right of the dialog is split: a label and a dropdown arrow. The dropdown offers two options.
Table Profile is the faster option. The platform reads the source table’s metadata (column names, data types, comments) and runs one AI pass to interpret it. Use this when the table is large, when you trust the source system’s naming, or when you want a starting point quickly.
Data Profile is the slower, more thorough option. The platform samples rows from the table, profiles the actual data shape (uniqueness, empty rates, sample values), and then applies AI interpretation on top. Use this when the source data quality is unclear, when column names don’t tell you much, or when you need to make decisions about which fields matter.
Run the profile
- Pick Table Profile or Data Profile from the dropdown. The button label updates to your choice.
- Confirm Source Name is set, or set it now. The platform uses it to interpret the source structure correctly. SAP, Oracle, Pronto Xi, or whatever system this data came from. If your source isn’t on the list, type a name and click Add to create a custom entry.
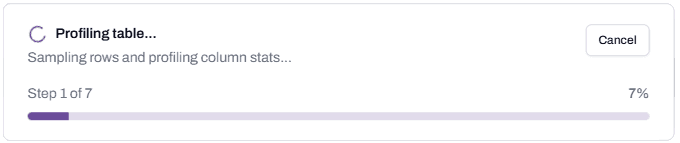
- Click the profile button. The dialog shows a progress modal stepping through the profile phases.
- Wait for the profile to complete. Table Profile typically takes seconds; Data Profile takes longer because it samples actual data.
What you see after profiling
The Edit Source Table Mapping dialog now lists every column in the source table, with rows showing:
- The source field name.
- An arrow pointing to the storage field name (the platform’s suggestion).
- A bar that visualises uniqueness when Data Profile was run.
- A toggle indicating whether the field is currently set to load.
- The data type.
Each source field has an info icon. Hover or click it to see column comment, profile samples (rows scanned, empty percentage, uniqueness percentage), sample values, and a recommendation on whether to include the field and why.

Why Source Name matters
The Source Name isn’t just a label. The platform uses it to ground the AI’s interpretation of the source data. If you tell it the source is SAP, the platform knows that BSART means Document Type, that LOEKZ marks deletion, that EBELN is a Purchase Order number. If you don’t tell it, the platform falls back to generic interpretation, and the recommendations are weaker.
If your source system isn’t on the platform’s list, type its name into the Source Name field and click the Add option that appears. The custom source is saved for future use. If you have specific knowledge of the source’s data structures, the platform will use the name to ground its analysis as best it can.
Re-profiling
A profile can be re-run any time. Click the dropdown again and pick the same or different option. Re-running overwrites the previous profile.
Reasons to re-profile:
- The source table has changed (new columns, new data).
- You ran Table Profile first and now want Data Profile’s deeper analysis.
- The recommendations from the first run looked off.
Re-profiling doesn’t undo any field mappings you’ve made. Existing mappings stay in place; the recommendations and metadata refresh.
What happens next
You now have a profiled source table with field-level recommendations. The next step is mapping the source fields to model fields. See Map source fields to model fields.
Troubleshooting
The profile fails or stalls
Likely cause: the warehouse the studio uses is queued or undersized for the table you’re profiling, especially with Data Profile on a large table.
Resolution: check the warehouse status in Snowsight. Wait for the current job to finish, or ask an admin to scale up DATA_STUDIO_WH. See Set up warehouses for the studio.
Before contacting support: capture the source table name, which profile option you ran, the time of the failure, and the warehouse load chart.
The recommendations look generic or wrong
Likely cause: Source Name isn’t set, or the table is genuinely unusual and the platform doesn’t have a strong prior on it.
Resolution: set Source Name to the correct source system if it isn’t already, then re-run the profile. If recommendations are still off, you can override every recommendation manually in the next mapping step.
Before contacting support: capture the source table name, the Source Name value you used, and screenshots of the recommendations.
FAQs
Should I always run Data Profile?
No. Table Profile is enough when the source system is well-known (SAP, Oracle, Pronto Xi) and the column names are self-explanatory. Data Profile is worth the extra time when names are cryptic, when the source data quality is unclear, or when you need to choose between similar-looking fields.
How many rows does Data Profile sample?
The platform samples a fixed number of rows from the table (the progress modal shows the count when it runs). For large tables, the sample is statistically representative but not exhaustive.
Does profiling cost anything?
Profiling uses your account’s Cortex compute and the studio’s warehouse. The cost is small for a single table. Running Data Profile across many tables in quick succession is worth keeping an eye on in Snowsight.
Related articles
- Prerequisite: Connect a source table to a model
- Sibling: Map source fields to model fields
- Next step: Map source fields to model fields
- Troubleshooting: Set up warehouses for the studio
Search keywords
profile source table, table profile, data profile, source name, profile recommendations, sample data, uniqueness, profiling progress